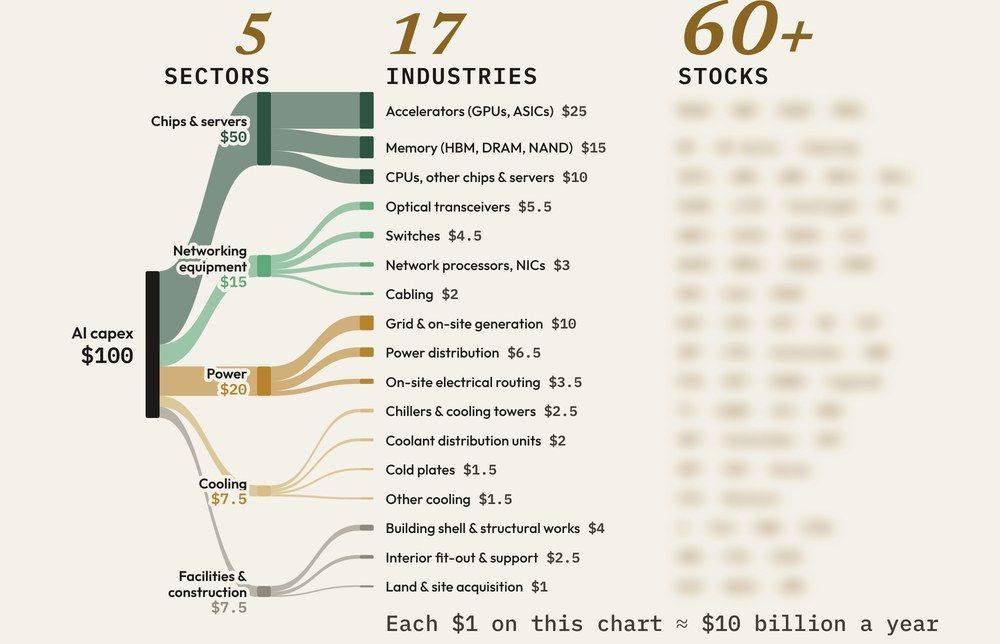
For every $100 spent on AI, $20 goes to power. Not chips.
Power, cooling, networking and buildings take half of nearly $1 trillion a year. Our free map names the 60+ stocks it lands with.
Everyone talks about AI. Few can say who gets paid.
Where's the opportunity?
You hear the same three names every day. The rest of the money is invisible.
It's complex.
GPUs, HBM, optics, liquid cooling. The jargon alone is a wall.
Guessing is costly.
Buying the story without knowing the business is how good money gets lost.
The map clears the first two in eight pages. The last page shows how to handle the third.
Half of it isn't chips or servers.
Five sectors, seventeen industries. The other half goes to places most investors never look.
Three lines you won't see on the evening news.
buys the machines that print chips. Every leading-edge chip passes through one company's scanner.
buys the optics that link the chips, one of the five bottlenecks BNP Paribas names.
buys land, and sites with power already secured trade at a premium.
The map names every one of them. Follow the dollar, not the headline.
Eight pages, short enough to read tonight.
The full split
5 sectors and 17 industries, with the dollars behind each one.
60+ stocks, named
With tickers, mapped to the industry each one earns from, across the US, Europe, Japan, Korea, Taiwan and China.
The five bottlenecks
The supply limits BNP Paribas says could set the pace of the whole build-out.
What the map can't do
One page on why knowing the names isn't yet a trade, and what decides whether a view makes money.
BNP Paribas research. Mapped by the OptionPundit desk.
The dollar split comes from BNP Paribas CIB's October 2026 research on the AI build-out. The stock mapping is ours, from a desk that has taught options since 2006.
See where the money lands, and who it lands with.
5 sectors, 17 industries, 60+ stocks. In your inbox in a minute.
A teaching document from OptionPundit, an education brand of A&K Pte Ltd, Singapore. Positioning, not recommendations: companies are listed by the segment they earn from, and inclusion is not a recommendation to buy, sell or hold anything. The dollar split is BNP Paribas CIB's estimate (AI infrastructure investment 2026, 5 Oct 2026) and may change. Nothing here is financial advice or tailored to your circumstances.
© A&K Pte Ltd. OptionPundit and the OptionPundit wordmark are trademarks of A&K Pte Ltd.