Apple Earned $130 Billion. How Much Did It Hand Back? (Owner Earnings, Step by Step)
Have you ever looked at a company's profit and wondered how much of it the owners actually get?
Last week I posted one chart on Instagram. Apple earned about $130 billion over the last 12 months. The question was simple: how much of that did it hand back to its shareholders?
The answer isn't the one most people guess. But the more useful lesson is how you get to the answer. Today I'll walk you through every step, with Apple's own numbers from its SEC filings, so you can do the same for any company you own.
Why the headline number fools smart people
When a company reports earnings, the first number you see is net income. It's in the headline, on every finance site, in every news story. So that's the number we anchor on.
There's nothing foolish about this. Net income is real, audited and easy to find. The trouble is that it answers an accountant's question (what did the business earn under the rules?) and not an owner's question (how much cash could I take out without hurting the business?).
Some finance sites offer a second ready-made number, free cash flow. It's closer, but most versions add stock pay back as if it cost nothing. A ready-made number is convenient, and convenience is exactly why we stop asking questions.
Buffett's answer, from 1986
Warren Buffett gave this problem a name in his 1986 letter to Berkshire Hathaway shareholders. He called it owner earnings:
(a) reported earnings, plus (b) depreciation, depletion, amortization and certain other non-cash charges, less (c) the average annual amount of capital spending the business needs to fully maintain its long-term competitive position and its unit volume. (If the business needs extra working capital to stay where it is, that comes off too.)
Then he said something most experts never say about their own formula:
"Our owner-earnings equation does not yield the deceptively precise figures provided by GAAP, since (c) must be a guess, and one sometimes very difficult to make."
He still preferred it: "we consider the owner earnings figure, not the GAAP figure, to be the relevant item for valuation purposes."
Keep that humility in mind. We're going to make that guess for Apple, carefully, and then show you how much the answer moves if you guess differently.
Mei Ling's bakery: owner earnings in one story
Before the billions, picture Mei Ling, who owns a small bakery in Tiong Bahru.
Her accountant tells her the bakery made $100,000 profit last year. But that profit was after a $15,000 depreciation charge on her ovens, which cost her no cash this year. So she adds it back: $115,000.
Then reality steps in. One oven is wearing out and must be replaced just to keep baking the same number of loaves: $8,000. Customers now pay on 30 days' credit, so $5,000 is tied up in unpaid bills. Both come off: $102,000.
Last, she gave her head baker a small share of the bakery instead of a pay rise. No cash left the till, but Mei Ling now owns less of her own business. That's a real cost, so she doesn't add it back.
What Mei Ling can safely take home is about $102,000. That's her owner earnings. Apple works the same way, with more zeros.
Step 1: Use the latest 12 months
Apple's financial year ends in September, and the latest filing is the quarter to 27 June 2026. To get the most recent 12 months (called "trailing twelve months", or TTM), take the last full year, add this year's nine months, and subtract last year's nine months.
| Net income (US$ billions) | Amount |
|---|---|
| Full year to Sep 2025 | 112.01 |
| plus 9 months to Jun 2026 | + 101.46 |
| less 9 months to Jun 2025 | − 84.54 |
| 12 months to Jun 2026 | 128.93 |
Every number below is built the same way from Apple's 10-K and 10-Q filings.
Step 2: Add back the non-cash charges
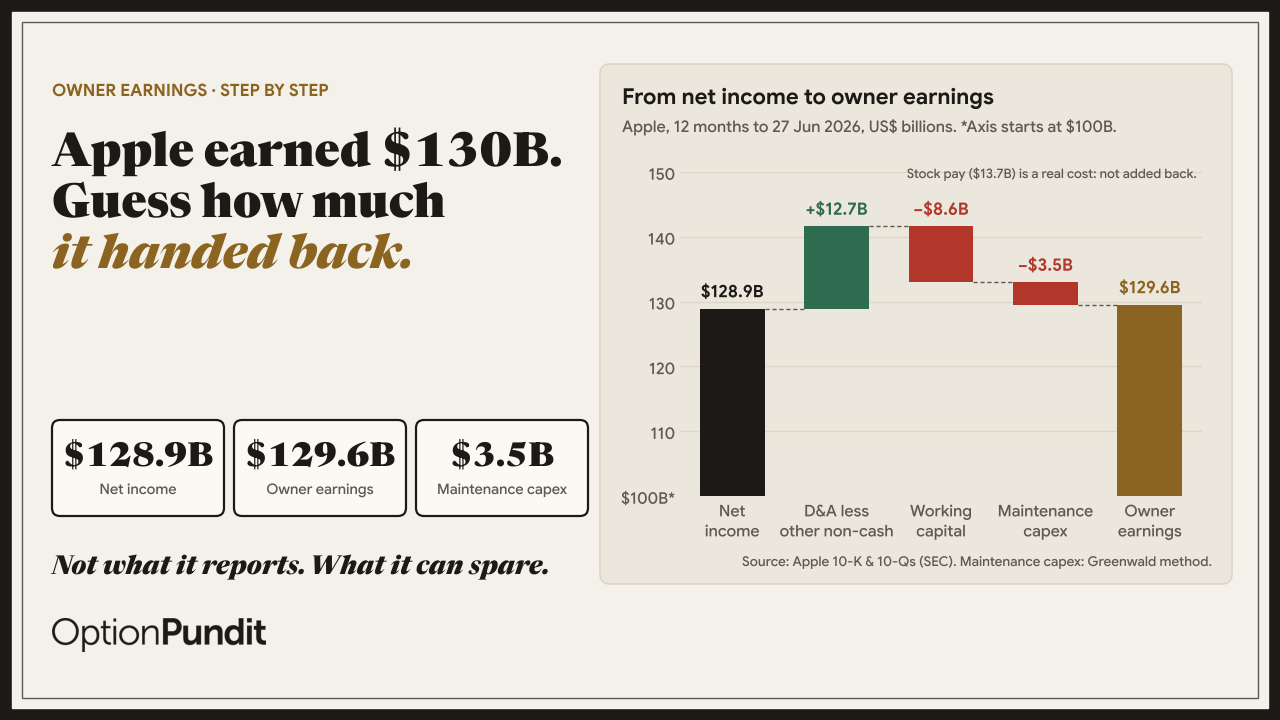
Depreciation and amortization ($13.10 billion) spread the cost of past spending over time. No cash left Apple for them this year, so they go back in. Apple also reports a small line of other non-cash items. Over these 12 months it nets to minus $0.38 billion, so it comes off.
128.93 + 13.10 − 0.38 = $141.65 billion
Step 3: Take out the cash tied up in working capital
Over the 12 months, $8.63 billion more cash got tied up in the day-to-day running of the business (receivables, inventory and other operating items, less what Apple owed its own suppliers). Like Mei Ling's unpaid bills, that's cash the owners can't take out.
141.65 − 8.63 = $133.02 billion
Step 4: Estimate maintenance capex (the guess Buffett warned about)
Apple spent $10.04 billion on property and equipment over the 12 months. Some of that keeps the business where it is (maintenance). Some of it builds for growth. Only maintenance belongs in owner earnings, because growth spending is a choice that should earn its own return.
Companies don't report the split, so we estimate it. I use the method from Bruce Greenwald's book Value Investing: From Graham to Buffett and Beyond: work out how many dollars of equipment Apple needs for each dollar of sales, then treat the equipment needed for this year's extra sales as growth.
4a. Equipment per dollar of sales, last five years
| Year to Sep | Net property & equipment | Sales | Ratio |
|---|---|---|---|
| 2021 | 39.44 | 365.82 | 10.8% |
| 2022 | 42.12 | 394.33 | 10.7% |
| 2023 | 43.72 | 383.29 | 11.4% |
| 2024 | 45.68 | 391.04 | 11.7% |
| 2025 | 49.83 | 416.16 | 12.0% |
| Average | 11.3% |
4b. How much did sales grow?
12 months to Jun 2026: $466.82 billion
12 months to Jun 2025: $408.63 billion
Growth: $58.20 billion (up 14.2%)
4c. Split the capex
Growth capex = 11.3% × 58.20 = $6.58 billion
Maintenance capex = 10.04 − 6.58 = $3.46 billion
133.02 − 3.46 = $129.56 billion
Step 5: Treat stock pay as the cost it is
Apple paid its people $13.71 billion in stock over the 12 months. The cash-flow statement adds this back, because no cash left the bank. Many free-cash-flow figures you'll see online keep it added back.
We don't. Every share handed to an employee is a slice of the company the existing owners no longer have. It's Mei Ling's head baker, at Apple scale. So stock pay stays out, and our total stays at $129.56 billion.
The answer: Apple's owner earnings
| Owner earnings, 12 months to 27 Jun 2026 | US$ billions |
|---|---|
| Net income | 128.93 |
| + Depreciation & amortization | + 13.10 |
| − Other non-cash items | − 0.38 |
| − Cash tied up in working capital | − 8.63 |
| − Maintenance capex (Greenwald) | − 3.46 |
| Stock pay ($13.71B): a real cost, not added back | 0.00 |
| = Owner earnings | 129.56 |
You can check it another way. Apple's operating cash flow was $146.72 billion. Take out all capex ($10.04B) and you get the usual free cash flow of $136.68 billion. Take out stock pay ($13.71B) and add back the growth capex ($6.58B): 136.68 − 13.71 + 6.58 = $129.55 billion. Same answer, within rounding.
Notice the gap: free cash flow says $136.7 billion; owner earnings say $129.6 billion. That $7.1 billion gap is the $13.71 billion of stock pay the ready-made number leaves out, partly offset by the $6.58 billion of growth capex that owner earnings don't charge against owners.
The Weekly Edge · free, every Sunday
Want a breakdown like this every Sunday?
One lesson and one chart, like the Apple numbers above, in your inbox before the market opens on Monday. Free.
So how much did Apple hand back?
| To shareholders, 12 months to 27 Jun 2026 | US$ billions |
|---|---|
| Share buybacks | 82.23 |
| Dividends | 15.64 |
| Total | 97.87 |
97.87 ÷ 129.56 = 0.755
For every dollar of owner earnings, Apple handed about 76 cents back to its shareholders.
If you check this on a finance site such as Stock Analysis, you may see buybacks of about $88.9 billion. That figure also counts the $6.70 billion Apple paid in taxes on employees' share awards (Apple keeps some of the vested shares and pays the tax in cash, which works much like a buyback). Count it that way and the payout is about 81 cents. We use the buyback line Apple itself reports, so we say 76.
Where did the rest go?
On the Instagram chart I showed "everything else" as $31.7 billion (129.56 − 97.87). That's a net figure, and you deserve the full picture.
Because stock pay costs no cash, Apple actually had $143.27 billion of cash to work with (129.56 owner earnings + 13.71 stock pay). Here's every dollar of it:
| Where the cash went | US$ billions |
|---|---|
| Share buybacks | 82.23 |
| Dividends | 15.64 |
| Debt paid down (long-term 9.40 + commercial paper 7.88) | 17.27 |
| Investments and other | 11.57 |
| Growth capex | 6.58 |
| Taxes paid on employees' share awards | 6.70 |
| Added to cash | 3.28 |
| Total | 143.27 |
So the real "everything else" was $45.4 billion of cash uses, of which $13.7 billion was paid for by stock pay. 45.40 − 13.71 = 31.69. That's the $31.7 billion on the chart.
One more honest note. Part of those buybacks simply soaks up the new shares Apple gives its staff. Even so, the share count is falling: about 14.95 billion diluted shares in the April to June quarter of 2025, about 14.71 billion a year later, roughly 1.6% fewer. Each remaining share owns a slightly bigger slice of Apple.
What we know, and what nobody knows
Here's what we know: these numbers come straight from Apple's filings, and the arithmetic ties out to the dollar.
Here's what nobody knows: the true maintenance capex. Greenwald's method is a careful guess. A cruder, more conservative guess is to treat all depreciation ($13.10B) as maintenance. Then:
128.93 + 13.10 − 0.38 − 8.63 − 13.10 = $119.92 billion
97.87 ÷ 119.92 = 0.816, or about 82 cents per dollar
So Apple's owner earnings sit somewhere around $120 to $130 billion, depending on the guess. And a fast-growth year like this one (sales up 14%) makes Greenwald's growth share larger, which flatters maintenance. If Apple needs to spend much more to stay competitive in the years ahead, the number would shrink. Nobody can tell you today whether it will.
That range is not a weakness of the method. It's the honest version of a number that GAAP pretends to know precisely.
How to do this for any company in 20 minutes
- Open the latest 10-K and 10-Q (free on SEC EDGAR, or the company's investor page).
- Build the last 12 months: full year + this year to date − last year to date.
- Start with net income. Add depreciation and other non-cash charges.
- Take out the cash tied up in working capital.
- Estimate maintenance capex both ways: Greenwald, and depreciation. Write down both.
- Never add stock pay back.
- Compare buybacks plus dividends with owner earnings. Then ask where the rest went.
Bottom line
Net income tells you what a company earned under the rules. Owner earnings tell you what an owner could take out and still keep the business as strong as it is. For Apple, that was about $130 billion over the last 12 months, and about 76 cents of every dollar went back to shareholders.
The habit to take away: before you trust any earnings number, ask "how much of this could the owners actually take home?" Then do the steps yourself.
Frequently asked questions
What are owner earnings?
A measure Warren Buffett described in 1986: reported earnings, plus depreciation and other non-cash charges, less the capital spending needed to keep the business as competitive as it is today (and any extra working capital it needs). It estimates the cash an owner could take out without weakening the business.
Are owner earnings the same as free cash flow?
No. Free cash flow usually subtracts all capital spending, including growth, and usually adds stock pay back. Owner earnings subtract only maintenance spending and treat stock pay as a cost. For Apple, free cash flow was $136.7 billion; owner earnings were $129.6 billion.
Why shouldn't stock-based compensation be added back?
Because it's real pay. The company could have paid cash and didn't; it paid with a slice of the business instead. Existing owners bear that cost through dilution, or through the buybacks needed to offset it.
How do you estimate maintenance capex?
Companies don't report it. Two common methods: Greenwald's (use the average ratio of property and equipment to sales to estimate the growth part, and treat the rest as maintenance), or treat depreciation as a stand-in for maintenance. Use both and look at the range.
What does TTM mean, and why use it?
Trailing twelve months: the most recent four quarters. It gives you a full year of data without waiting for the annual report. Build it as full year + current year to date − prior year to date.
Is a high payout to shareholders always good?
Not by itself. Returning cash makes sense when the business can't reinvest it at high returns. The better question is whether the company is still investing enough to stay strong, and whether it buys back shares at sensible prices.
Learn to value a business like an owner
This is the kind of work we do in Value Investing Secrets™: understanding what a business is worth before you buy its shares, so you can hold great companies with confidence. If you'd like to start, watch the free class, Uncover Hidden Gem Stocks and Build Lasting Wealth.
And if you'd like one clear idea like this every week, get The Weekly Edge, free.
Try the steps on a company you own, and tell me what you find on Instagram (@optionpundit). I'd love to hear which number surprised you.
Happy trading,
Manoj
Sources
- Apple Inc. Form 10-K for the year ended 27 Sep 2025, and Forms 10-Q for the quarters ended 28 Jun 2025 and 27 Jun 2026 (SEC EDGAR, XBRL company facts, CIK 0000320193). Every figure checked twice: against the SEC data feed and against the statements as filed.
- Warren Buffett, 1986 Letter to Berkshire Hathaway Shareholders, Appendix (owner earnings).
- Bruce Greenwald et al., Value Investing: From Graham to Buffett and Beyond (maintenance capex method).
Figures in US$ billions, rounded to two decimals; totals may differ by 0.01 due to rounding. Education, not advice. This is not a recommendation to buy or sell any security.