Do you feel a little uneasy when the calendar turns to October?
You're in good company. In 1894, Mark Twain wrote:
“October. This is one of the peculiarly dangerous months to speculate in stocks in. The others are July, January, September, April, November, May, March, June, December, August and February.”
Mark Twain, Pudd'nhead Wilson, 1894
Twain was joking. Wall Street mostly isn't. Ask a room of investors to name the scariest month for stocks, and most hands go up for October.
This week I went through 20 years of market data to see whether that fear holds up. The answer surprised even me, and I've been trading through Octobers for over 20 years. Wall Street does fear October. It just fears it for the wrong reason.
Why the fear makes sense
The crashes have names, and an unusual number of them carry an October date. The Stock Trader's Almanac lists the crashes of 1929 and 1987, the 554-point Dow drop on 27 October 1997, back-to-back massacres in 1978 and 1979, Friday the 13th in 1989, and the 733-point Dow drop on 15 October 2008.
On 19 October 1987, the Dow fell 22.6% in a single day. In October 2008, the S&P 500 lost 16.9% in one month.
Here's the behaviour behind the fear. Our minds don't store history as a spreadsheet. They store it as stories, and the most dramatic stories win. Nobody tells their grandchildren about the October when the market rose 2%. So when we think “October”, we remember 1929, 1987 and 2008, not the quiet years in between.
That's not a flaw in you. It's how every human memory works. But it means the feeling and the facts can drift apart. So let's look at the facts.
What 20 years of data actually say
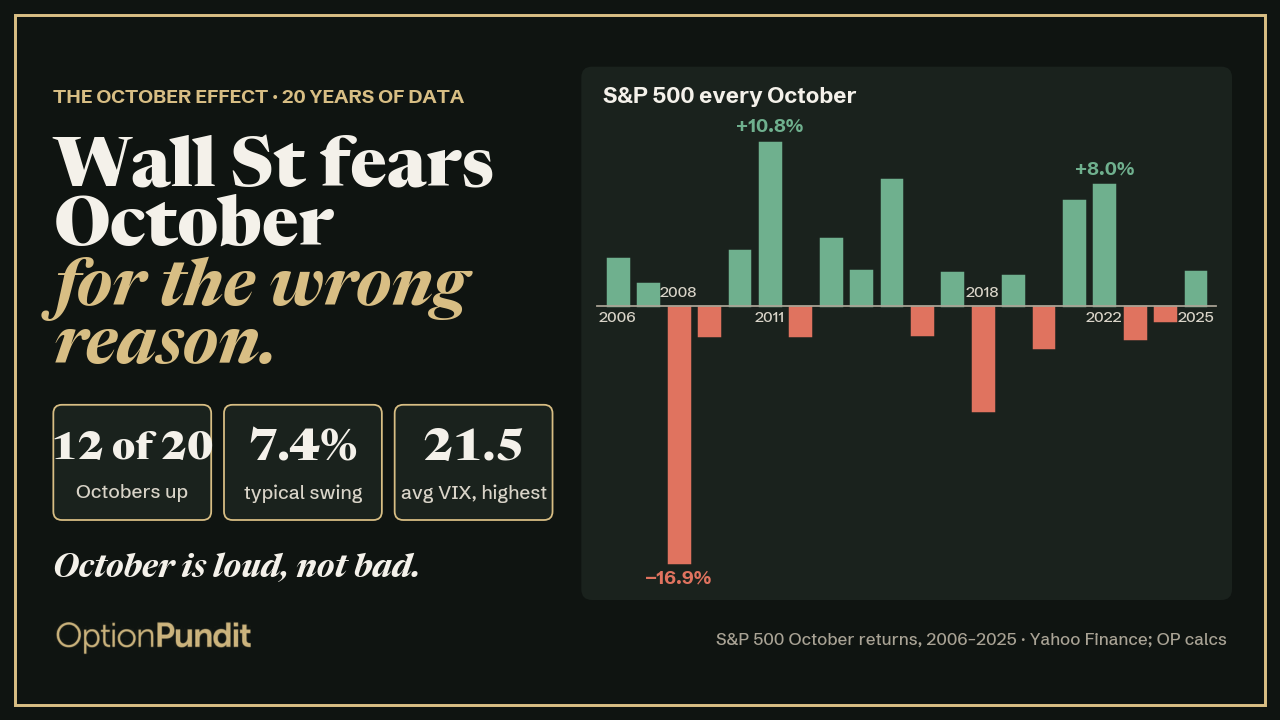
I took every October from 2006 to 2025 for the S&P 500, measured from the last close of September to the last close of October.
- The S&P 500 rose in 12 of the 20 Octobers.
- The middle result (the median) was +2.1%. That's the highest median of any month in those 20 years, a whisker ahead of November.
- The average was +1.0%, pulled down by one year: 2008. Take out 2008 and the average is +1.9%.
- In the last 10 years, October rose five times and fell five times. On direction alone, it's a coin flip.
The Nasdaq Composite tells a similar story: up in 12 of 20 Octobers, with a median of +3.6%.
Here is every October, so you can see it for yourself:
| Year | October | Biggest drop inside the month |
|---|---|---|
| 2006 | +3.2% | −0.8% |
| 2007 | +1.5% | −4.1% |
| 2008 | −16.9% | −26.9% |
| 2009 | −2.0% | −5.6% |
| 2010 | +3.7% | −1.6% |
| 2011 | +10.8% | −2.5% |
| 2012 | −2.0% | −3.6% |
| 2013 | +4.5% | −2.3% |
| 2014 | +2.3% | −5.4% |
| 2015 | +8.3% | −1.2% |
| 2016 | −1.9% | −1.7% |
| 2017 | +2.2% | −0.7% |
| 2018 | −6.9% | −9.7% |
| 2019 | +2.0% | −2.0% |
| 2020 | −2.8% | −7.5% |
| 2021 | +6.9% | −1.3% |
| 2022 | +8.0% | −5.6% |
| 2023 | −2.2% | −5.9% |
| 2024 | −1.0% | −2.7% |
| 2025 | +2.3% | −3.0% |
“Biggest drop inside the month” is the largest fall from a closing high to a later closing low within October.
So if October isn't a losing month, why does it feel so dangerous? Look at the third column.
The half that's true: October swings harder
October doesn't pick a direction. It picks a size.
Over these 20 years, October had:
- The widest spread of monthly results of any month. Its returns ranged from −16.9% to +10.8%. The standard deviation, a measure of how far results stray from normal, was 6.1%. Every other month sat between 3.2% and 4.8%.
- The biggest typical swing inside the month. In a typical October, the S&P 500 moved 7.4% from its high to its low within the month. Other months ranged from 5.1% to 6.7%.
- The highest average VIX of any month: 21.5, against 19.5 across all days. The VIX is often called Wall Street's fear gauge. It measures how big a move options traders expect over the next month.
- Seven of the 20 Octobers saw a fall of 5% or more inside the month: 2008, 2009, 2014, 2018, 2020, 2022 and 2023.
The Nasdaq follows the same pattern. October was its most volatile month too.
There's one more detail worth knowing, because it matters for how you think about risk. Most Octobers are ordinary. If you look at the typical October, its day-to-day movement is no wilder than other months. The reputation comes from a handful of violent years, like 2008, 2018 and 2020. October isn't rough every year. When it goes wrong, it goes very wrong.
Why October? Nobody can prove a single cause. The Almanac's editors attribute the September weakness and October volatility to fund tax selling, end-of-quarter window dressing and portfolio restructuring. October is also when third-quarter earnings season begins. Those are reasonable theories, not laws. I'd hold them lightly.
The twist: October also ends bear markets
Here's the part almost nobody talks about.
The Almanac's editors coined the term “bear-killer” for October back in 1968, in the second edition of the Stock Trader's Almanac. By their count, October turned the tide in thirteen post-WWII bear markets: 1946, 1957, 1960, 1962, 1966, 1974, 1987, 1990, 1998, 2001, 2002, 2011 and 2022.
That count is generous, because it includes turns across different indices. Measured strictly by the S&P 500's own bottoms, the Almanac counted 7 of 23 post-WWII bear markets bottoming in October, significantly more than any other month. Either way, October has a habit of ending things as well as starting them.
In our 20-year window, the period from the end of September to the end of December rose in 16 of 20 years.
And look at what happened after the seven rough Octobers. In the following two months, November and December, the S&P 500 rose four times: +7.6% in 2009, +2.0% in 2014, +14.9% in 2020 and +13.7% in 2023. It fell three times: −6.8% in 2008, −7.6% in 2018 and −0.8% in 2022.
That's the honest picture. History rhymes. It doesn't promise. Four out of seven is not a rule you can bet the house on, and I won't pretend otherwise. Nobody knows what this October will bring, and anyone who tells you they do is guessing.
A story from October 2022
Let me tell you about two traders. Ravi and Mei are composites of traders I've worked with over the years, not real people, but their Octobers are very real.
By October 2022, the market had been falling all year. On 4 October, the S&P 500 bounced. Ravi felt relief. Then it fell for six straight days. By 12 October, the index was 5.6% below its high of just eight days earlier.
Ravi had been reading the headlines every night. Inflation. Rate hikes. “Worst year since 2008.” On the morning of the 12th, he couldn't take it anymore. He sold everything.
The next morning, 13 October, the inflation report came out hot. The market dropped sharply at the open. Then it turned and closed 2.6% higher. By 31 October, the S&P 500 was 8.3% above its 12 October low. That 12 October close turned out to be the end of the S&P 500's bear market.
Ravi wasn't wrong to be worried. 2022 was a hard year. His mistake wasn't his view. It was that he made his biggest decision at the moment he felt the most fear.
Mei went through the same October. The difference is she'd made her decisions in September. When the swings got bigger, she cut her position sizes so that a bad week would sting, not wound. She knew in advance where she would exit if the market broke lower. When the noise came, she didn't have to decide anything. She followed her plan.
Psychologists Daniel Kahneman and Amos Tversky showed that a loss hurts roughly twice as much as a gain of the same size feels good. That's why big swings are so dangerous to our decisions. When the market moves twice as hard, the pain feels far louder, and the urge to make it stop becomes overwhelming.
The month didn't hurt Ravi. His reaction to the noise did.
October is loud, not bad.
Four rules for a loud month
You don't need to predict October. You need a plan for how you'll act when it gets loud.
1. Size for the swing, not the story. When swings get bigger, trade smaller. If a position would keep you up at night in a 7% swing, it's too big for October.
2. Decide your exit before the noise. Write down where you'll get out before you get in. The worst exits are made in panic, and October is when panic is easiest to find.
3. Follow the trend, not the calendar. “Sell before October” sounds wise, but 12 of the last 20 Octobers rose. The calendar is a reason to be alert, not a signal to act.
4. Remember that fear has a price. When the VIX rises, option premiums rise with it. Put simply, the price of insurance goes up when people are scared. Some traders pay that price; others are paid it. Bigger premiums come with bigger moves, so this is a reason to understand options well, not a free lunch.
What nobody knows
I can tell you how the last 20 Octobers behaved. I can't tell you how this one will. Neither can anyone else. What I can tell you is that the traders who handle October well aren't the ones who guessed right. They're the ones who decided in advance how they'd behave, then kept their word to themselves.
That's a skill, and like any skill, it can be learned. It's what we work on with our community at OptionPundit every week.
Bottom line
October's reputation is only half true. It's not a losing month: the S&P 500 rose in 12 of the last 20, with the highest median result of any month. But it is the loudest month, with the biggest swings and the highest fear. And it has often been the month when bear markets end. Respect the size of October's swings, size your trades for them, and make your decisions before the noise arrives.
Frequently asked questions
Is October the worst month for the stock market?
No. From 2006 to 2025, the S&P 500 rose in 12 of 20 Octobers, and October had the highest median return of any month. Its reputation comes from a few historic crashes and from being the most volatile month.
What is the “October effect”?
It's the belief that stocks tend to fall in October. The data don't support it as a reliable pattern. What the data do show is that October tends to have bigger swings than other months.
Why is October so volatile?
There's no proven single cause. Common explanations include fund tax selling, end-of-quarter portfolio changes and the start of earnings season. Treat these as theories, not rules.
What is the VIX?
The VIX measures how much movement options traders expect in the S&P 500 over the next 30 days. A higher VIX means traders expect bigger swings, which is why it's called the fear gauge.
Should I sell my stocks before October?
History doesn't support selling based on the calendar alone. A better approach is to make sure your position sizes and exit plans fit the bigger swings October can bring. This is education, not personal advice.
What do you do when markets get jumpy? Tell me in the comments. Got a question? Ask below. I'll be happy to answer it or cover it in a coming post.
If this post helped you, please share it with someone who gets nervous when the markets turn jumpy. It might help them more than you think.
And if you'd like a lesson like this every week, sign up for The Weekly Edge just below. It's free, it comes out every Sunday, and I read every reply myself.
Happy trading,
Manoj
Sources and method
- S&P 500 and Nasdaq Composite: monthly and daily closes from Yahoo Finance, October 2006 to December 2025. Price returns only, no dividends. All return, swing, standard deviation and median figures are OptionPundit calculations.
- VIX: daily closes from Yahoo Finance, 2006 to 2025.
- October crash history, the “bear-killer” term and the thirteen post-WWII bear markets: Stock Trader's Almanac, “October 2023 Almanac & Vital Stats” and “October Outlook: Bear-Killer and Bargain Month” (29 September 2022).
- Bear-market bottoms by month: Jeffrey A. Hirsch, Stock Trader's Almanac, “More Bears End in October Than Any Other Month” (13 October 2022).
- Loss aversion: Daniel Kahneman and Amos Tversky, “Prospect Theory” (Econometrica, 1979).
- Mark Twain, Pudd'nhead Wilson (1894).
Past performance doesn't predict future results. Education, not advice.