Have you ever finished a good month of trading and thought, "I finally get it"? And then watched the next month quietly take it all back?
If that's happened to you, you're in good company. And the reason is rarely the one we blame. It isn't usually the market, the news or bad luck. It's a single number most traders never work out.
Let me show you what it is, why it matters more than any setup or indicator, and how to find yours this week.
Not beginners. Not a bad week.
In 2020, three economists in Brazil, Fernando Chague, Rodrigo De-Losso and Bruno Giovannetti, published a study with a blunt title: Day Trading for a Living?
They had something most studies don't: the records of every individual who began day trading mini-Ibovespa futures, Brazil's most traded equity futures, between 2013 and 2015. Then they looked at the people who stuck with it for 300 days or more.
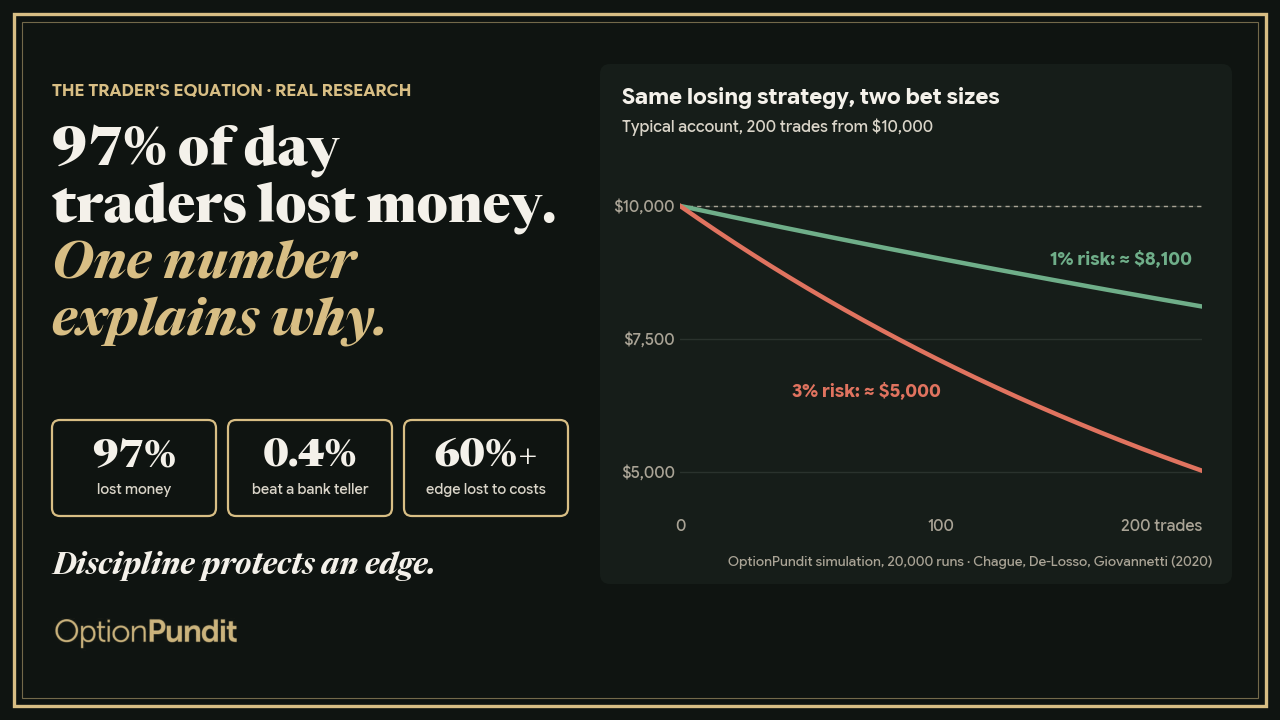
97% of them lost money. Only 0.4% earned more than a bank teller, about US$54 a day. And the researchers found no evidence that people got better by doing it.
Read that last part again, because it's the uncomfortable one. These weren't tourists who tried it for a week. They showed up, day after day, for more than a year of trading days. Persistence didn't save them.
So if hard work and time in the market don't fix it, what does?
Every trade has a number
Every trade you place has an average result built into it. Traders call it expectancy. I call it the trader's equation:
E = (win rate × average win) − (loss rate × average loss) − costs
In plain words: how often you win, times how much you usually make; minus how often you lose, times how much you usually lose; minus what each trade costs you in commissions, spreads and slippage (the gap between the price you wanted and the price you got).
Here's a simple example. Say you win 48% of your trades. When you win, you make 2.5%. When you lose, you lose 2.0%.
Before costs, each trade earns you +0.16% on average. That's a real edge. Small, but real.
Now add 0.1% per trade in costs. Your average falls to +0.06%. Costs just took more than 60% of your edge, and most traders never see it happen, because no single trade shows it. It only shows up when you add them all together.
That's the power of this number. If it's above zero, every trade nudges you forward, and time works for you. If it's below zero, every trade nudges you back, and time works against you. Working harder then means trading more, and trading more means losing faster.
Meet Dev
Dev isn't one person. He's a mix of patterns I've seen in traders over the years. You may recognise a little of yourself in him. I certainly recognise a little of my younger self.
Chapter one: the good start. Dev wins about half his trades, and that feels like skill. He keeps a rough eye on his profits, but he never adds up his costs. A commission here, a wide spread there, a little slippage when he jumps into a stock that's already moving. Each one feels too small to matter.
Chapter two: the bad run. Then come six losses in a row. Nothing dramatic, just steady. Dev feels the pressure building. He's sure the next trade will be the one, so he triples his size to win it back faster.
Chapter three: the maths catches up. This is where Dev's story becomes everyone's story. Suppose his real numbers, after costs, are a win rate of 45% with wins and losses the same size. That's a small negative edge. Not a disaster on its own.
We ran that strategy 20,000 times on a computer, over 200 trades, starting from $10,000.
- Risking 1% of the account per trade, the typical account ended near $8,100, with a worst fall of about 24% along the way.
- Risking 3% per trade, the same strategy ended near $5,000, with a worst fall of about 58%.
Same strategy. Same market. The only difference was the size of the bet. Bigger bets didn't fix anything. They just made the losses arrive faster and hit harder.
Chapter four: what Dev does next. We'll come back to him.
Why smart people do this
If you've ever raised your size after a run of losses, please don't feel foolish. Some of the most famous research in behavioural finance describes exactly this.
In 1990, the economists Richard Thaler and Eric Johnson described what they called the break-even effect. After a loss, people become more willing to take a bigger risk if it offers a chance to get back to even. The pain of being "down" pushes us to gamble our way back to zero.
In trading, that instinct is expensive. When your number is negative, a bigger bet doesn't buy you a better chance. It buys you a faster route to the same place.
There's a second trap too. A string of wins feels like proof of skill, even when the edge is thin or doesn't exist. We remember the wins, wave away the costs, and judge ourselves by our best weeks.
That's why I keep coming back to one line:
Discipline protects an edge. It can't create one.
Discipline, meaning small, consistent risk and following your rules on a bad day, is what lets a real edge survive the losing runs every strategy has. But discipline can't turn a negative number positive. The edge has to exist first, after costs.
What nobody can tell you
Here's the honest part. No one can tell you your number in advance, including me.
A backtest can estimate it. A course can teach you how to build it. But only your own trades can confirm it. And it isn't fixed: markets change, your costs change, and the way you trade changes when you're tired, busy or upset.
So treat your number as something you measure regularly, not something you prove once.
Your four numbers, this week
Here's what I'd ask you to do before your next trade. It takes less than an hour.
- Pull your last 30 or more trades from your journal or your broker's statement. Thirty is a minimum, and more is better.
- Work out four numbers: your win rate (what percentage of trades made money), your average win (the typical gain on a winning trade), your average loss (the typical loss on a losing trade) and your costs (commissions, spreads and slippage per trade).
- Put them into the equation.
- If the answer is below zero, don't add size. Cut to your smallest size, find which of the four numbers is weakest, and fix that first.
- If the answer is above zero, keep your risk small and consistent, and let the number do its work. Check it again every month.
That's what Dev did in chapter four. He stopped trading bigger and started measuring. His first answer was below zero, which was hard to look at. But for the first time, he knew what he was fixing.
Bottom line
Every trade has a number. If it's below zero after costs, no amount of effort or bet size will rescue it; bigger bets only speed up the losses. Find your four numbers, fix the weakest one, and let small, consistent risk protect the edge once you have one.
Building a trading process around these numbers, with a journal and fixed risk, is a skill. And like any skill, it can be learned.
Want the one-page version? I've put the trader's equation on a single page: the formula, the cost example, the bet-size simulation and the four numbers to track. DM me "EQUATION" on Instagram (@OptionPundit) and I'll send it to you.
Got a question about your own numbers? Send it to me. I read every message, and I may answer it in a coming post.
Happy trading,
Manoj
FAQ
What's a good win rate?
It depends on your average win and loss. In the example above (win 2.5%, lose 2.0%, costs 0.1%), you need to win about 46.7% of trades just to break even. A strategy that wins 40% of the time can be excellent if its wins are much bigger than its losses, and one that wins 70% can lose money if its losses are much bigger than its wins.
How many trades do I need before I can trust my numbers?
Thirty trades is a minimum to get a first read, and more is better. Results are noisy, so a short lucky or unlucky run can fool you. Keep measuring as your sample grows.
How much should I risk per trade?
Many professional traders keep the risk on each trade to around 1% to 2% of their account. The right size is one that lets you survive a long losing run without being forced to stop, or tempted to "win it back".
Sources: Chague, F., De-Losso, R. and Giovannetti, B. (2020), "Day trading for a living?", FGV EESP Discussion Paper 525 (also SSRN 3423101). Thaler, R. H. and Johnson, E. J. (1990), "Gambling with the House Money and Trying to Break Even: The Effects of Prior Outcomes on Risky Choice", Management Science 36(6), 643–660 (doi:10.1287/mnsc.36.6.643). The worked example and simulation are OptionPundit illustrations: 20,000 simulated runs of 200 trades each, median results shown. They are not a forecast. Education, not advice.